See what your agent is doing.
Replay what it did.
Zero intrusion, full replay, shareable snapshots — for OpenClaw agents.
Your agent is running 24/7.
Do you know what it's doing right now?
Your agent spawned 3 sub-agents. What did they do?
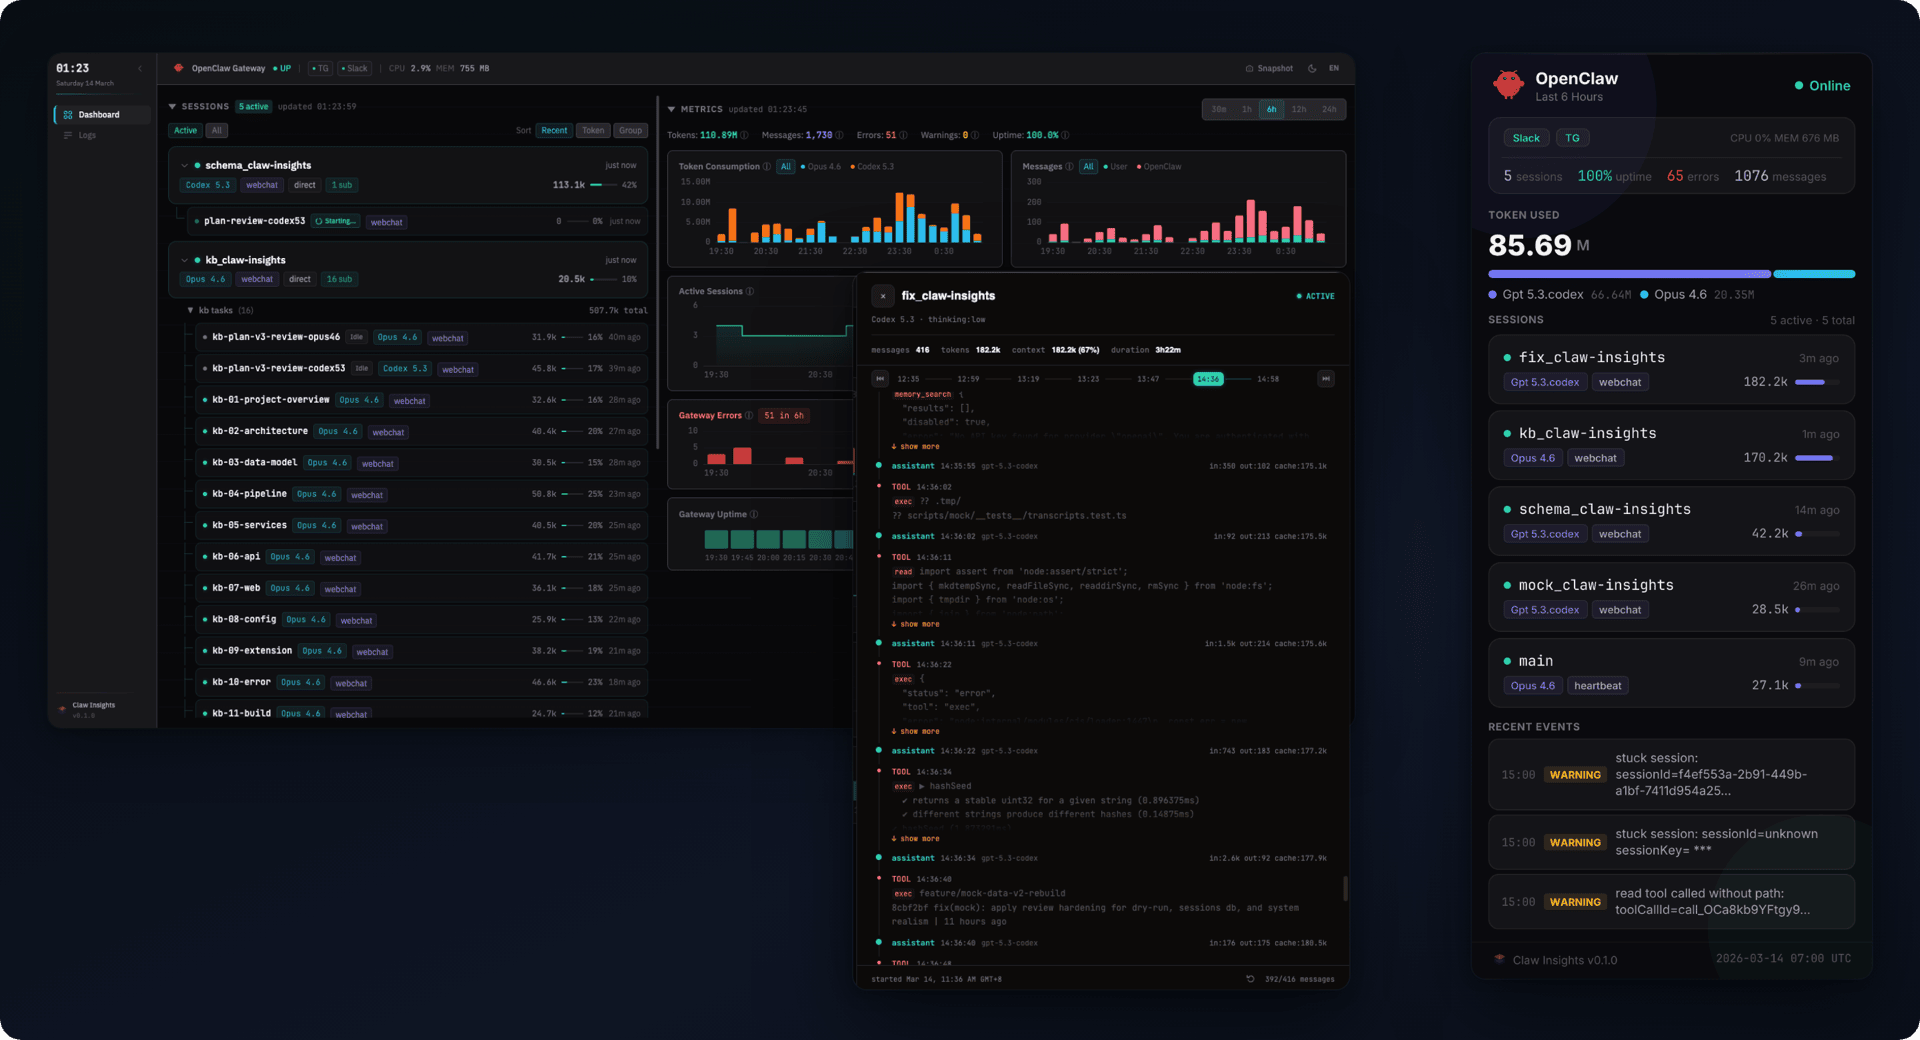
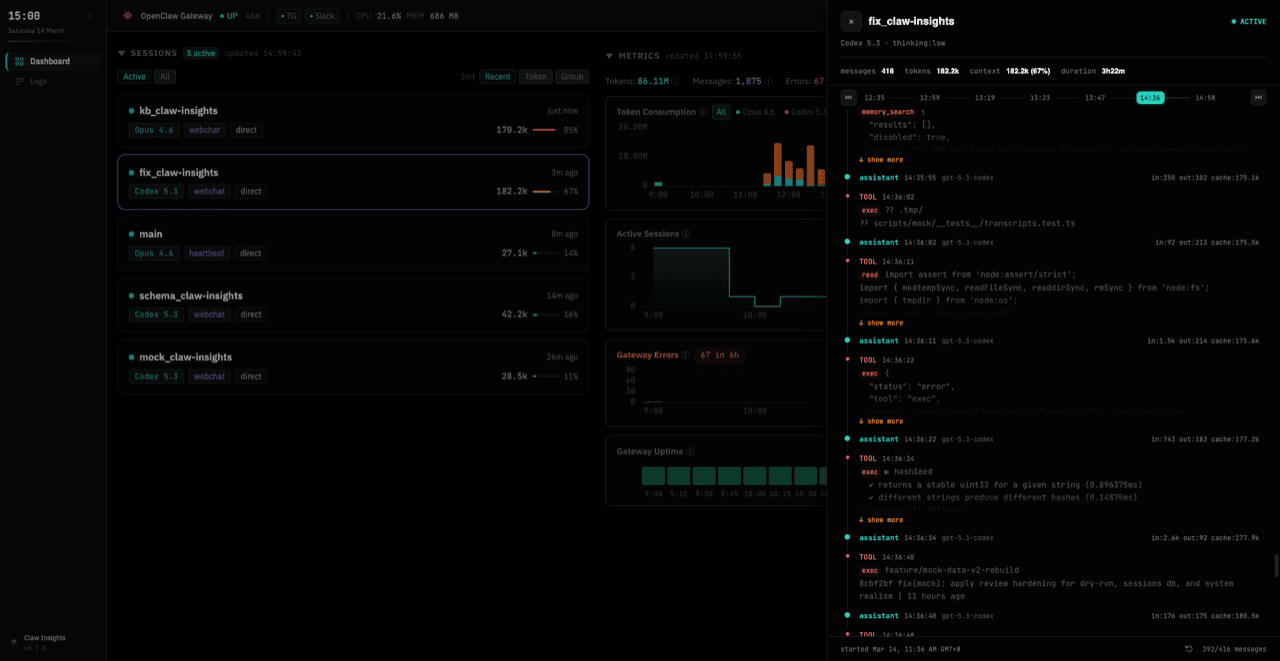
Open the session replay. Every message, every tool call, every token — laid out on a scrollable timeline with full diagnostic context.
200k context window, 80% full. Which turns ate it?
Per-turn breakdown by model, trend indicators that catch spikes, and context progress bars showing how full each session is.
5 sessions running, 100M tokens burned. How do you show that?
Generate a status snapshot — server-rendered PNG, no browser needed. Push it to Slack on a schedule, pin it in Telegram, or save for a report.
Everything you need to know.
Sessions, tokens, errors, and shareable reports.
Every session laid out with its sub-agent tree, context window usage, and per-model token split. Trend arrows flag spikes — you'll know which session is burning tokens before it hits the limit.

Click any session and read the full transcript — user messages, assistant replies, tool calls and their results, token cost per turn. No SSH, no log files. The conversation is right there.
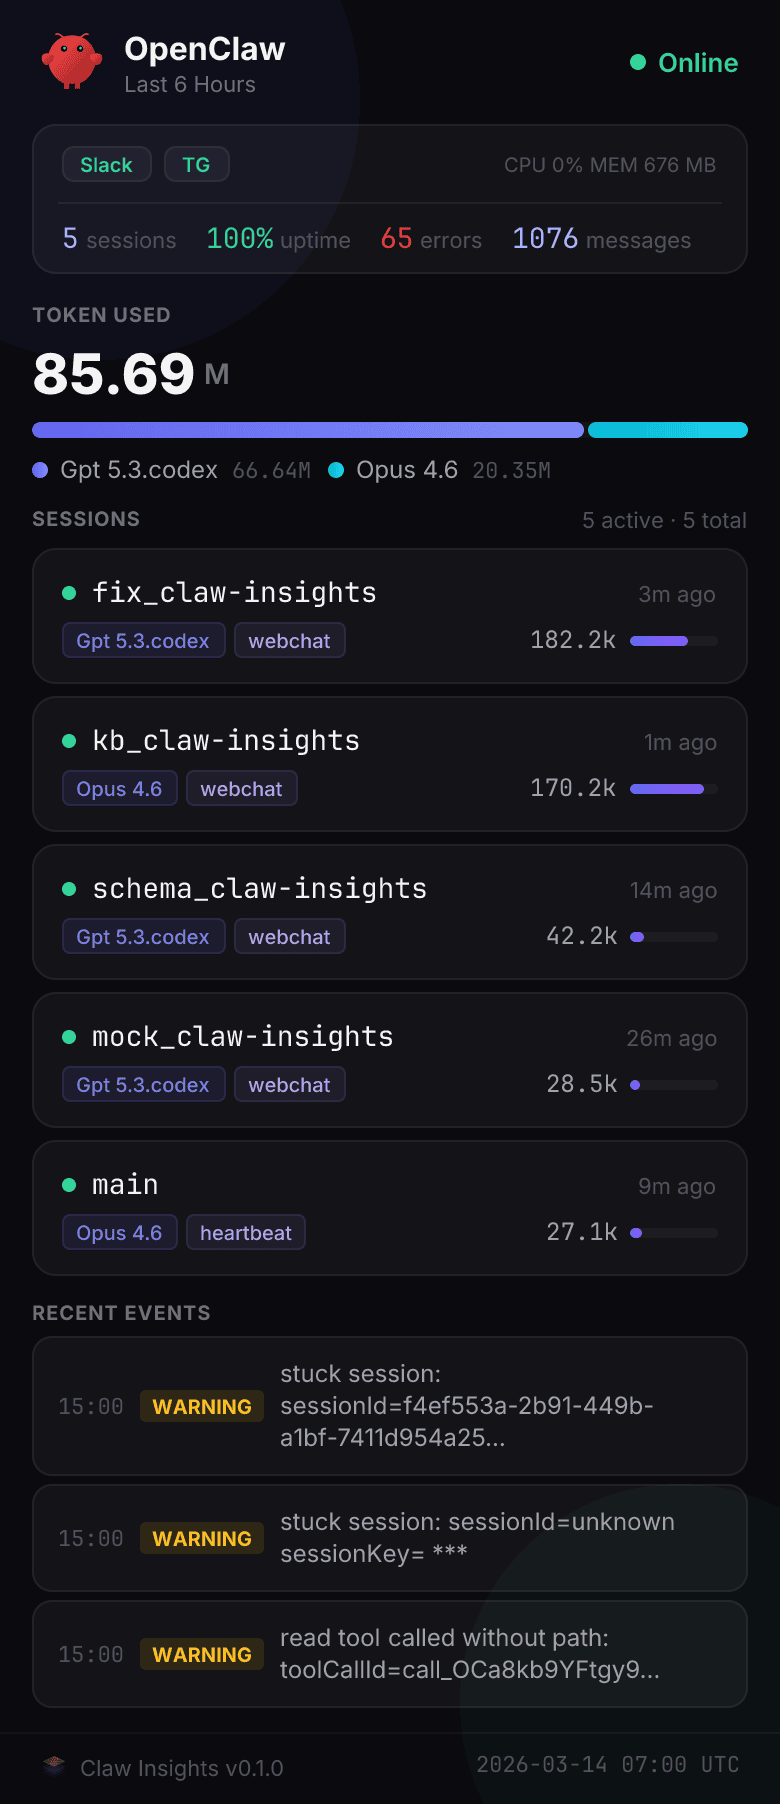
A visual status card — tokens, sessions, errors — rendered as PNG in ~200ms. Push it to Slack on a schedule, send it to Telegram, or save it for a report. No browser needed.
Every error, warning, and restart on a single timeline. A density heatmap shows the last 24 hours at a glance — spikes jump out immediately. Filter by type, search the full text, find what broke.

Up and running in 60 seconds
One command, one dashboard. Requires Node.js ≥22.5.
Install
Or via npm: npm install -g claw-insights
Start
Open
Click the token URL — you're in. Bearer token auth with session cookie keeps you authenticated.
no phone-home
audit everything
doesn't touch OpenClaw
zero configuration
Ready to see what your agent is doing?
Monitor in real time. Share a beautiful snapshot.
Or: npm install -g claw-insights